Grid Trading Strategy
Grid with AI‑generated lines, in‑memory hits, with live market data
Overview
A grid strategy builds a range of support and resistance levels from market sentiment and price history. These grid lines act as triggers for buy and sell actions.
We enhance grid generation by offloading it to OpenAI. We provide sentiment inputs (current price, EMAs, SMAs, risk level, etc.) and receive a set of grid lines centered around the current price.
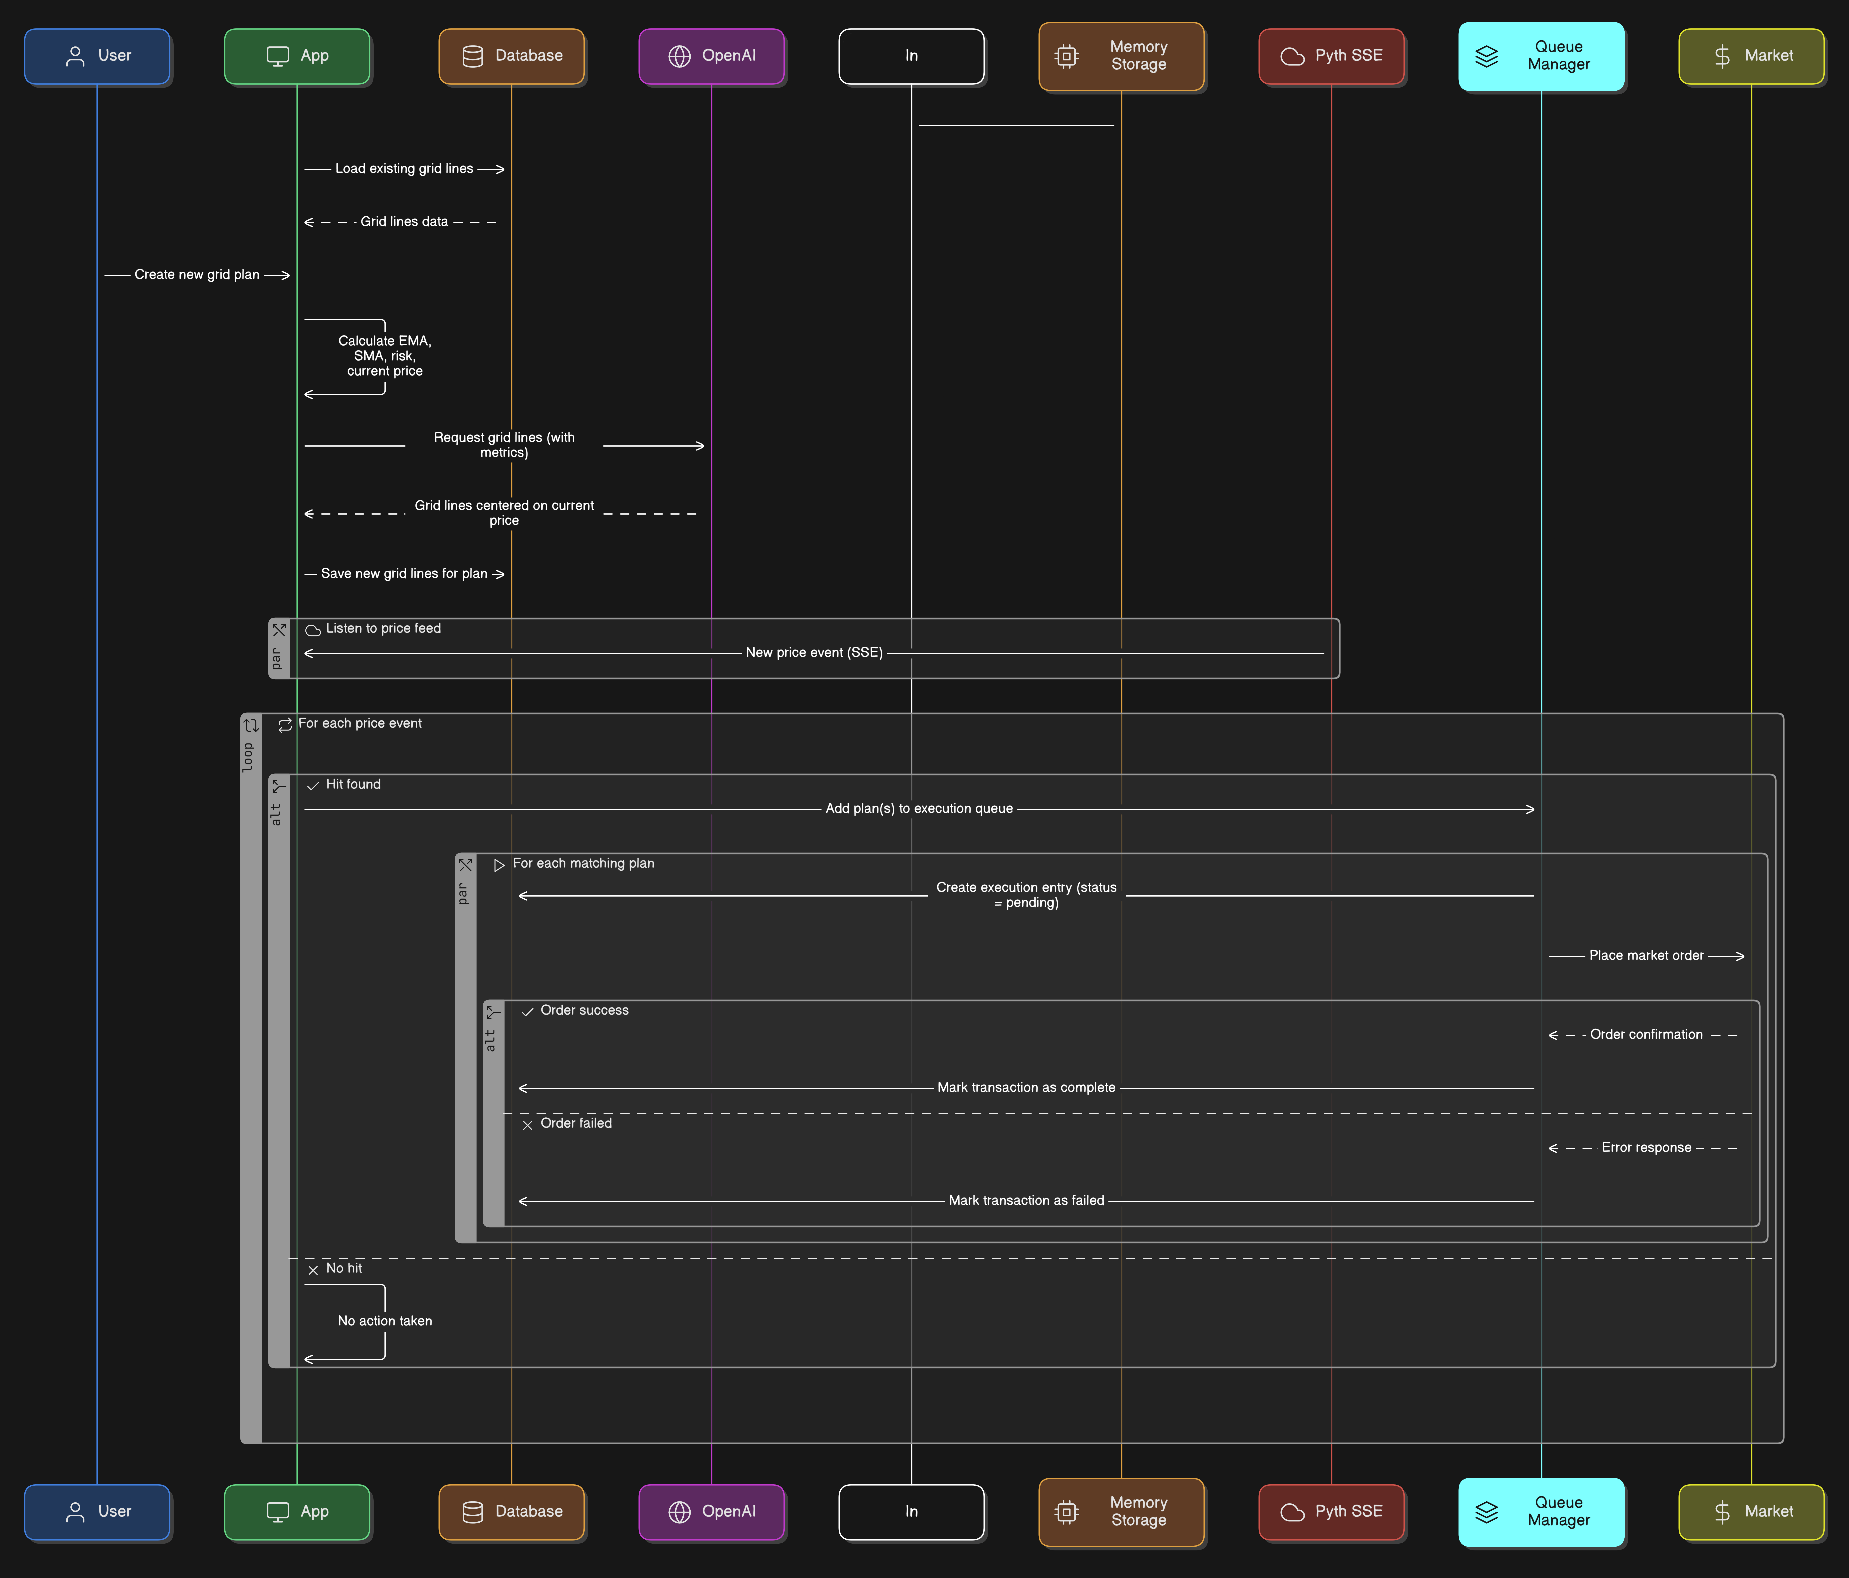
Execution diagram
Environments
- Live and Mock modes share an in‑memory store to query grid lines quickly and reduce misses, making the system faster and more reliable than DB‑only lookups.
- Unlike SDCA, we do not dedupe grid generation. Lines are generated once per plan, so dedupe is unnecessary unless regenerated on a schedule.
Live environment flow
Live mode uses real funds for real‑time execution. Some functionality is abstracted behind a task queue to avoid chain‑specific issues; this is shared across strategies.
- System loads existing grid lines from DB into memory
- User creates a grid plan
- Compute metrics (e.g., MVAs, EMAs)
- Send metrics to OpenAI to generate grid lines
- Persist grid lines per plan in DB
- Load those lines into the in‑memory store
- Subscribe to Pyth SSE events
- On each price event, query a composite key in memory for a hit:
- Key format:
token:price(used for inverted queries) - Each price is matched using a relative threshold (see Glossary)
- Key format:
- On a grid hit, add a task to the Queue Manager
- Queue Manager executes the task:
- Create DB transaction entry with status "pending"
- Place a market order (e.g., on Injective)
- Mark transaction complete or failed based on execution result
Mock environment flow
Mock mode mirrors live execution but runs over historical data and does not wait for live SSE events. We do not store mock transactions in DB to avoid clashes.
- Fetch 90D of 1h interval historical data
- Calculate metrics
- Fetch grid lines from OpenAI based on metrics
- Store grid lines in DB
- Load lines in memory
- Iterate over each historical price point
- Query for hits exactly like a live plan
- Collect and return the list of mock executions
Glossary
Relative threshold
Token prices can have very high precision, so exact equality checks will miss executions. A naive fixed percentage threshold fails for assets with large absolute prices (e.g., BTC), where a small percent can be a large dollar amount.
We use a relative threshold anchored in USDT terms (or token‑specific where needed). Instead of "0.01% around token price," we permit "up to X USDT worth of deviation" from the line price. This keeps tolerance meaningful across vastly different price scales.
Example: If the grid line is at 11.0922 INJ, a relative threshold might allow execution for any price whose USDT value is within a constant tolerance around that level, rather than a fixed percentage of INJ.
Inverted query
We may have many plans sharing the same grid price (e.g., 1000 INJ). Querying "all plans that contain this price" and then applying thresholds is inefficient and can approach O(n^2).
Instead, we invert the mapping and index plans by grid price:
// Key → Set of plan IDs
{token}:{price} -> Set<ObjectId>
On each price update, we compute the relevant keys (within threshold buckets), get the matching plans in O(1), and run them in parallel outside the wallet level. This reduces per‑event work from O(n) down to near O(1) for lookup, excluding threshold calculations.
Learn more
- Grid generation and execution code (Automated Grid): https://github.com/meowtrades/strategies-core/tree/main/Automated%20Grid
- Price monitoring and feeds: https://github.com/meowtrades